Tracing
Tracing provides a clear view of the internal steps taken by an agent when generating a response. It helps developers, product teams, and administrators understand how an agent arrived at its final output, including reasoning, tool execution, and any related diagnostic information.
1. Overview
The Tracing system provides visibility into agent execution steps, making it easy to understand how responses are generated. This transparency helps with debugging, user education, and product management.
Tracing can display internal steps such as reasoning sequences, information retrieval, tool calls, SQL queries, and custom diagnostic messages. These traces can be shown to all users or restricted to admin-only, depending on the visibility settings.
2. What Tracing Shows
Tracing can display various types of internal steps:
| Type | Description |
|---|---|
| Reasoning sequences | The logical steps the agent takes to arrive at a conclusion |
| Information retrieval steps | How the agent searches for and retrieves relevant data |
| Tool calls and tool responses | External API calls, database queries, or function executions |
| SQL queries or other operations | Database operations and data transformations executed by the agent |
| Custom diagnostic messages | Any additional information developers choose to expose |
3. Accessing Tracing in the UI
To access tracing:
Step 1: Start a conversation with an agent.
Step 2: Select Show Trace to open the trace panel.
Step 3: The trace panel opens and displays the internal steps for that conversation.
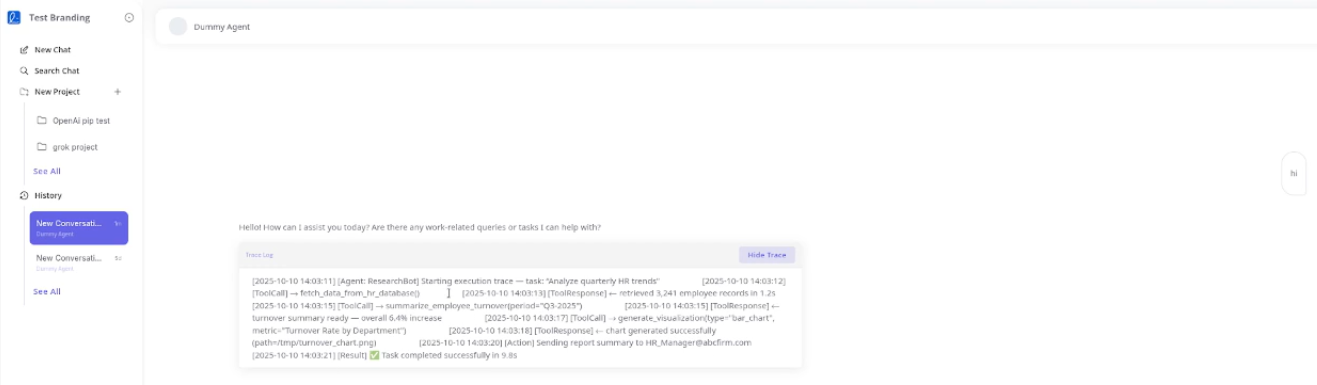 Image: Trace log panel showing detailed execution trace with timestamps, tool calls, and results
The trace panel displays:
- Timestamps: When each step occurred
- Tool calls: External API calls, database queries, or function executions
- Results: Outcomes of each operation
- Actions: Additional operations performed by the agent
Step 4: Select Hide Trace to collapse the panel.
Note: If tracing content was set with admin-only visibility, only admin users will see those entries in the panel.
4. Tracing Blocks in Markdown
Lexia supports tracing blocks in Markdown content. A tracing block defines a segment of diagnostic information meant for tracing and is processed by the frontend.
A tracing block has two components:
- visibility: Controls who can see the trace (all users or admin-only)
- content: The actual diagnostic information to display
Only the content of the block is rendered. The visibility controls whether the trace is displayed based on user role.
5. Tracing Block Structure
A tracing block uses the following pattern:
[lexia.tracing.start]
- visibility: all
content: Example trace content
[lexia.tracing.end]
Everything between the start and end markers is considered part of the tracing block.
6. Visibility Rules
Visibility supports two values:
| Value | Description |
|---|---|
| all | Visible to both admin and non-admin users |
| admin | Visible only to admin users |
7. Display Logic
The frontend determines whether to show or hide the block using these rules:
| Page State | Visibility Setting | Shown |
|---|---|---|
| Admin page | admin or all | Yes |
| Non-admin page | all | Yes |
| Non-admin page | admin | No |
Blocks that do not meet the visibility requirement are removed entirely from the rendered output.
8. Rendering Steps
Rendering a tracing block happens in three steps:
- Detect the block: Look for the start and end markers and extract the content.
- Check visibility: If the visibility matches the page context, the block can be shown.
- Render or remove: If allowed, display the content. If not, omit the entire block.
9. Example
Example from the specification:
[lexia.tracing.start]
- visibility: all
content: Debug Info
 Request ID: 9283-ABC
 Status: Success
[lexia.tracing.end]
Visibility behavior:
- If visibility is set to admin, the trace appears only on admin pages.
- If visibility is set to all, the trace appears everywhere.
10. When to Use Tracing
Tracing is useful when developers want to expose:
- Diagnostic information: Debug details about agent execution
- SQL queries or search queries: Database operations and search results
- Tool calls made by the agent: External API calls and function executions
- Reasoning steps: The logical progression the agent follows
- Internal workflows: Step-by-step processes within the agent
This helps users or product managers understand how a given answer was produced.
11. Example from the Video Transcript
The video demonstration explains how tracing is used to:
- Walk users through internal execution steps
- Display reasoning, tool usage, and data retrieval
- Show example trace content using dummy values
- Demonstrate visibility control
- Use Show Trace to reveal the trace panel
With visibility set to all, regular users can see the trace. When Show Trace is selected, the content becomes visible in the UI.