Lexia Interface Overview
This guide explains the complete Lexia interface. The same interface is used in both production and developer mode. The only difference is the data source:
- Production → uses deployed agents
- Developer Mode → uses your local agent running on localhost
Everything else in the UI is identical.
Layout Overview
Lexia's interface has three main parts:
- Left sidebar
- Center workspace
- Top bar
All features, chats, projects, file uploads, histories, and tools work the same whether you are in production or dev.
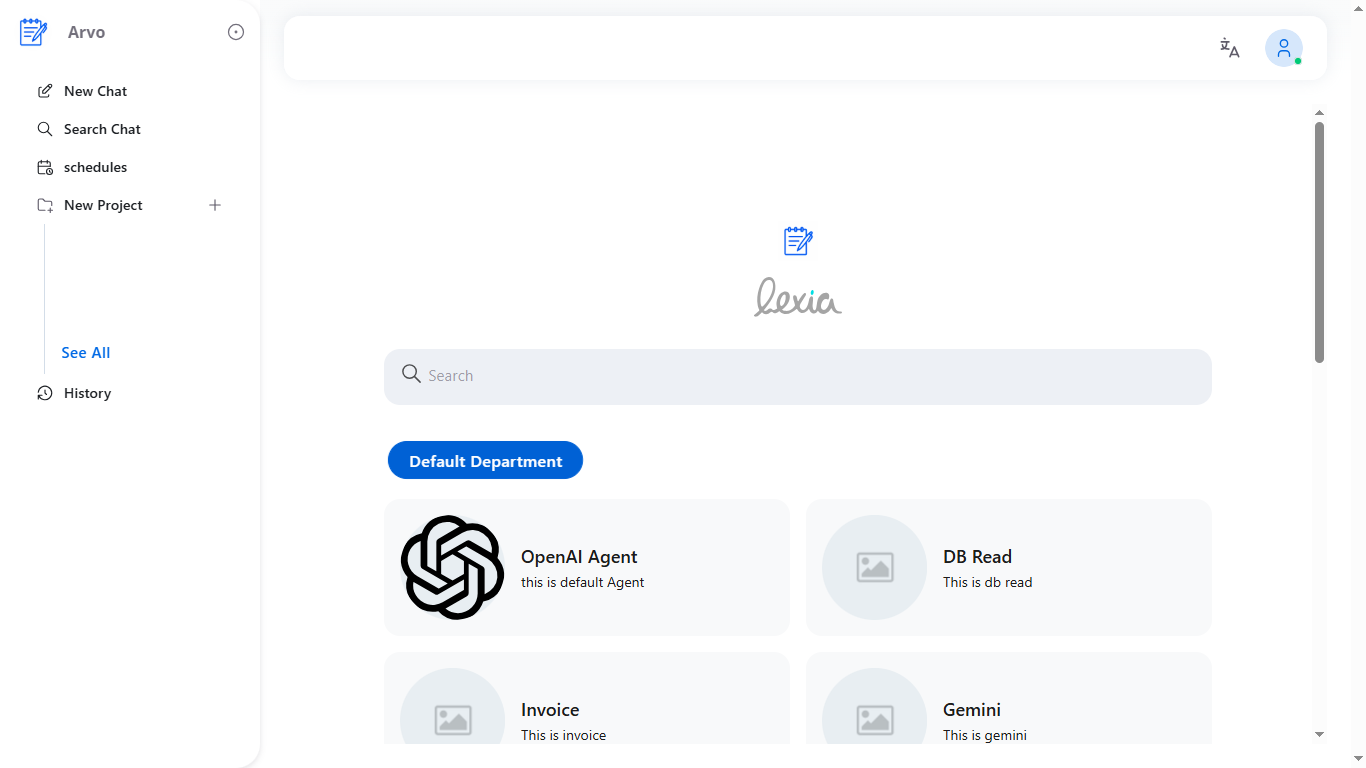 Image: Full Lexia interface showing the three main sections: left sidebar, center workspace, and top bar
Sidebar Navigation
New Chat
Starts a new conversation.
You can select an agent, type your message, upload a file, or send a prompt.
Once you send the message, the agent processes it and replies.
Search Chat
Opens a search panel showing all past chats.
Type a keyword and all matching messages appear in a scrollable list.
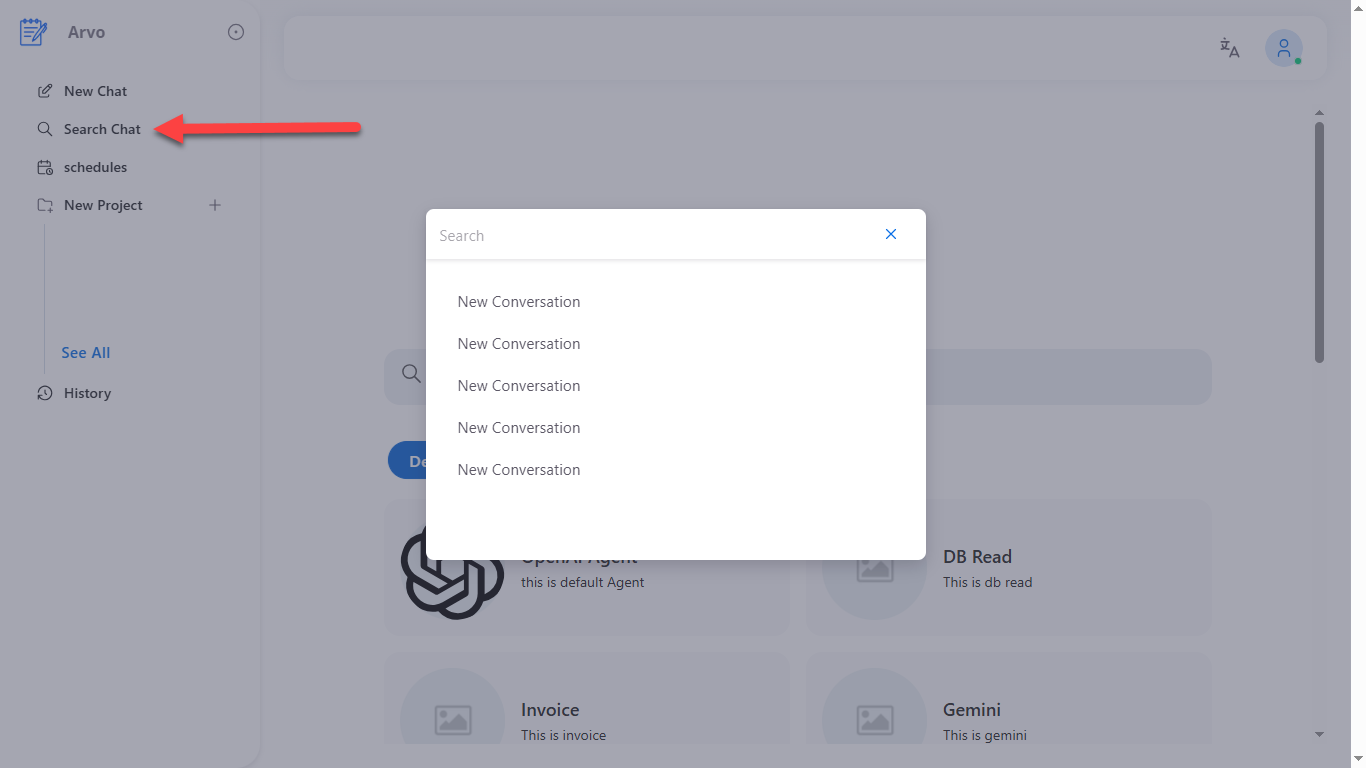 Image: Search panel with keyword input and scrollable list of matching messages
Schedules
Shows all scheduled messages that have been created.
Displays:
- Agent
- Message
- One-time or recurring
- Scheduled date and time
- Status
- Attempts
- Last run
You can also filter by agent or status.
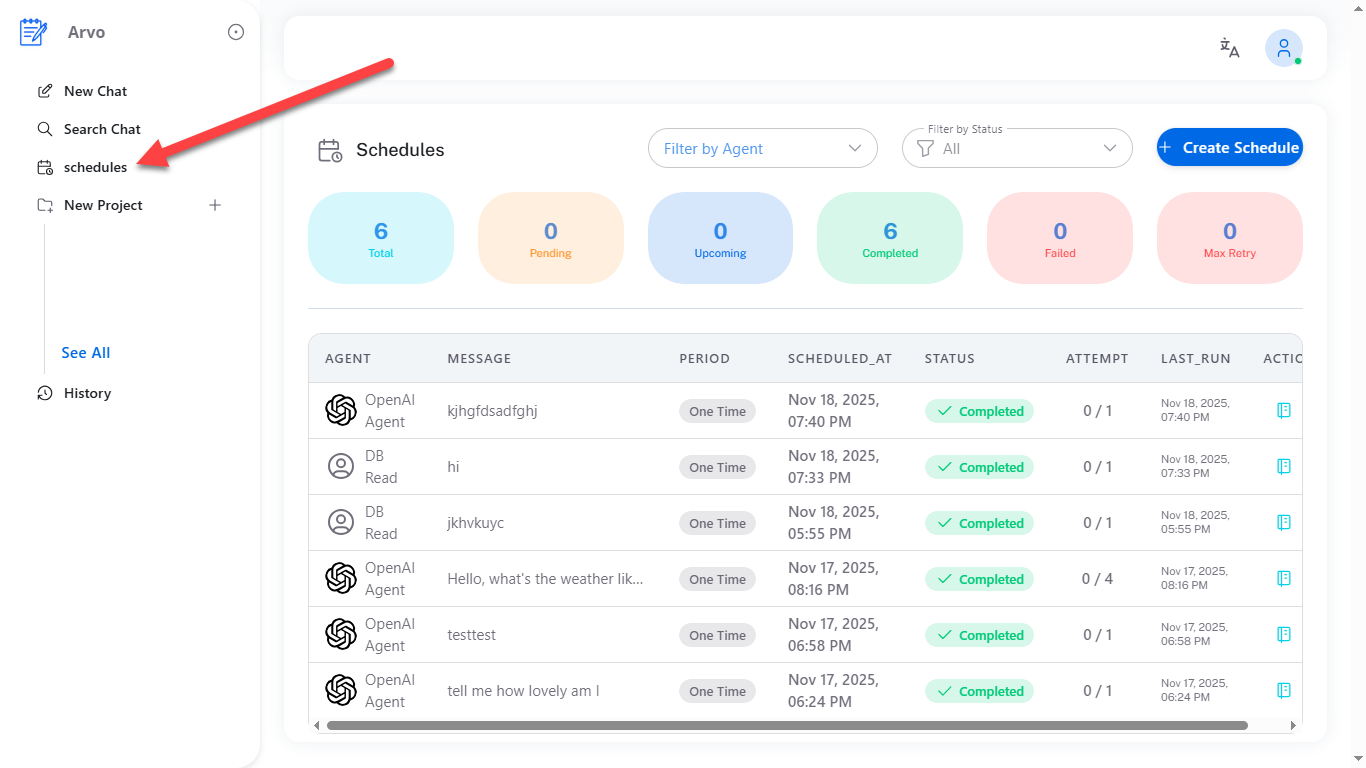 Image: Schedules panel showing list of scheduled messages with filters and status information
New Project
Creates a workspace where you can group chats, files, and instructions.
The modal includes:
- Project name
- System message
- Agent
- Model
After saving, the project appears in the sidebar under New Project.
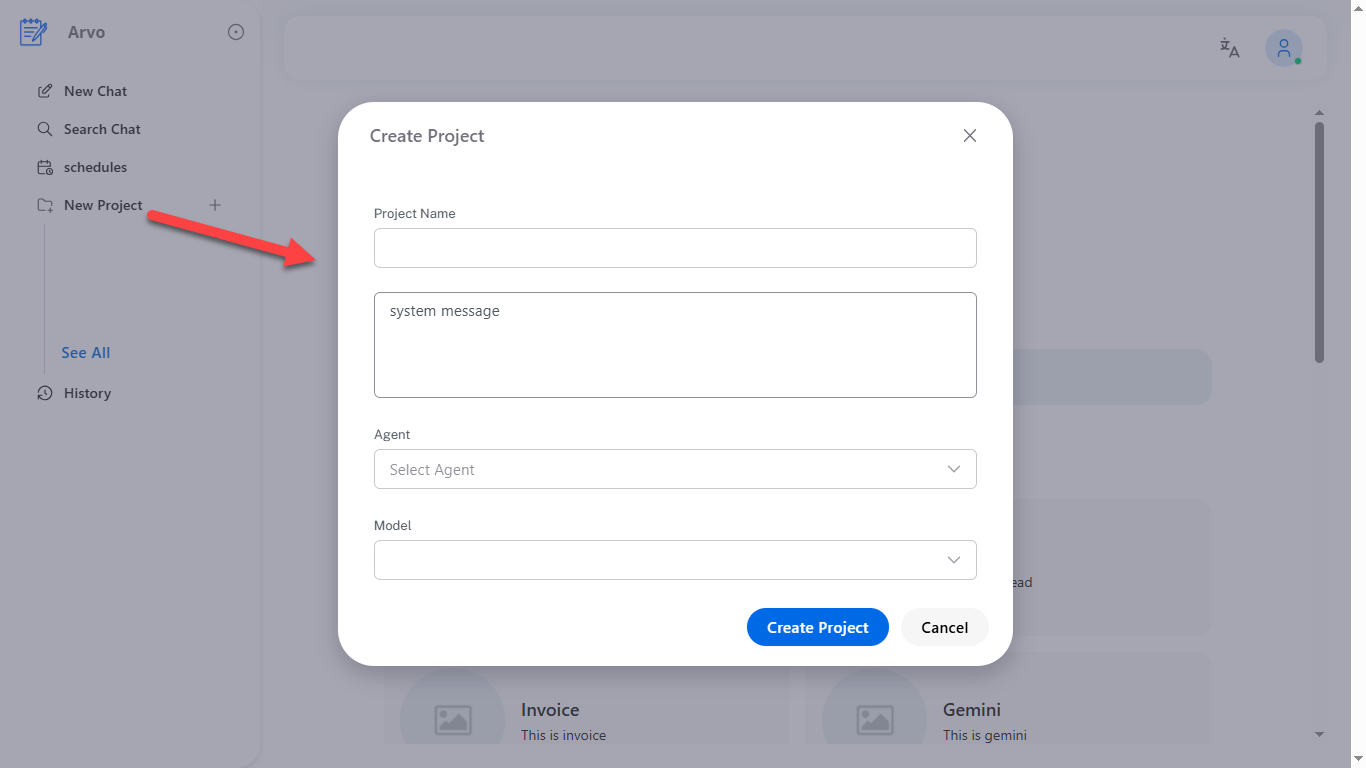 Image: New Project modal with fields for project name, system message, agent, and model selection
History
Shows your recent chat history.
Click any item to reopen the conversation.
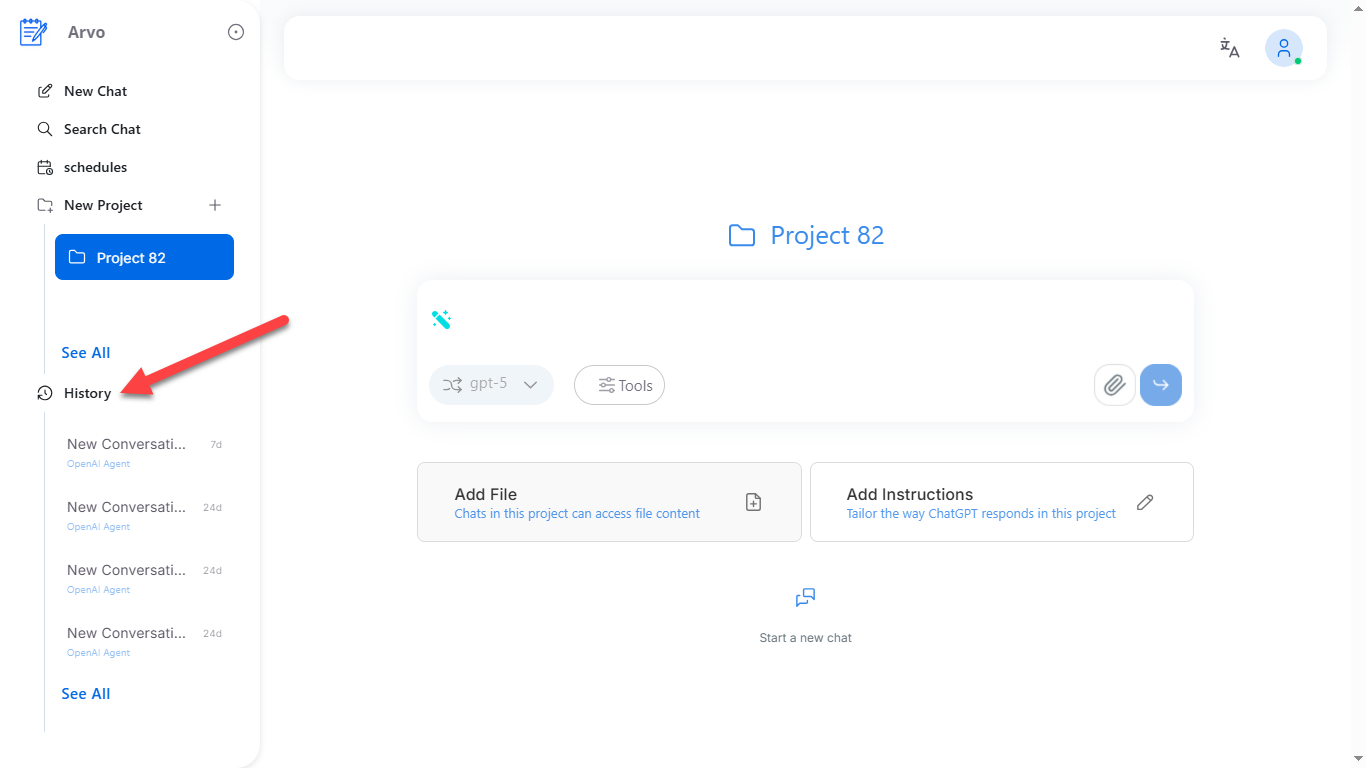 Image: History sidebar showing list of recent conversations with timestamps
Center Workspace
Agents and Departments
The home screen displays all available agents.
You can:
- switch departments
- search agents
- select an agent to start chatting
Project View
Inside a project, you see the following:
- Chat box
- Agent selector
- Model selector
- Tools button
- Add File
- Add Instructions
Files and instructions set inside the project apply to all chats inside that project.
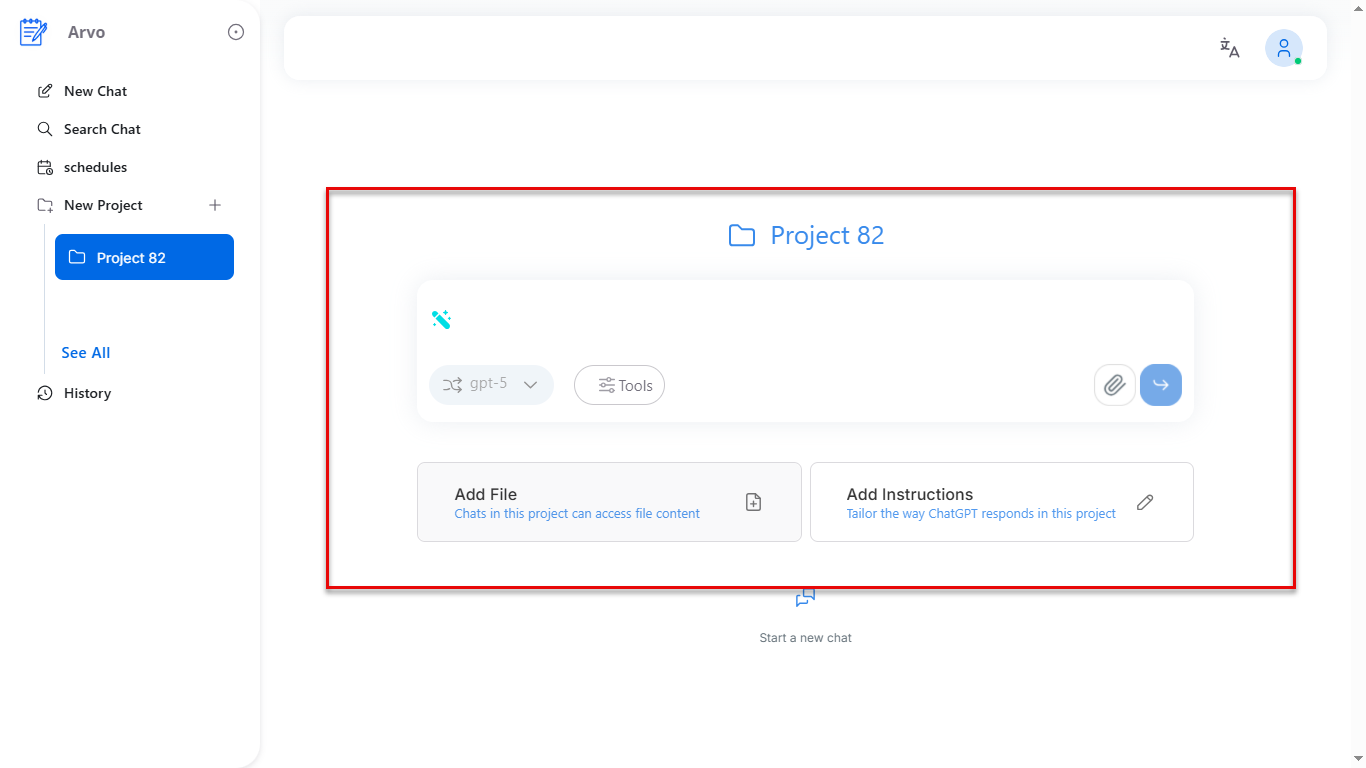 Image: Project workspace showing chat box, agent selector, model selector, tools button, and file/instructions options
Chat Window
This is where conversations happen.
Supports:
- Standard messages
- Images
- File uploads
- Tools
- Function call outputs
- Moderation messages
- Image generation status
- Streaming responses
You may see:
- Thinking indicator
- Tool call logs
- Function parameters
- Execution logs
- Image loading states
These appear the same in prod and dev.
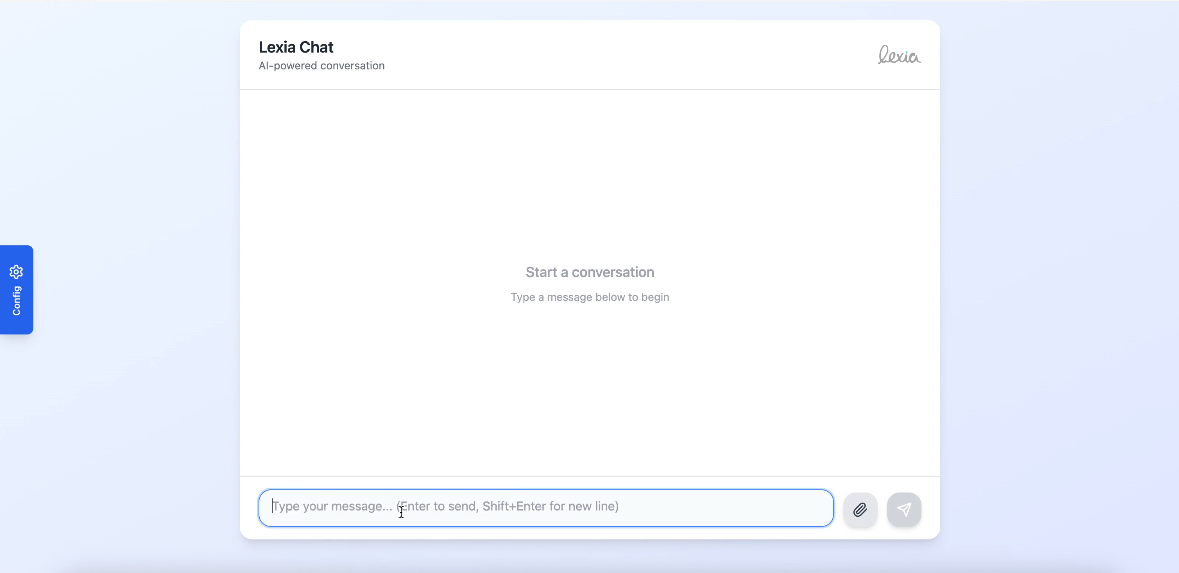 Image: Chat interface showing conversation with various message types, tool calls, and streaming responses
Moderation and System Messages
Chats may show:
- Content block messages
- Security alerts
- Safe-mode warnings
- Guardrail actions
These appear automatically based on the moderator settings configured in your agent.
Top Bar
Profile Menu
Shows your name and role.
Includes:
- Admin Mode
- Billing and Subscriptions
- Logout
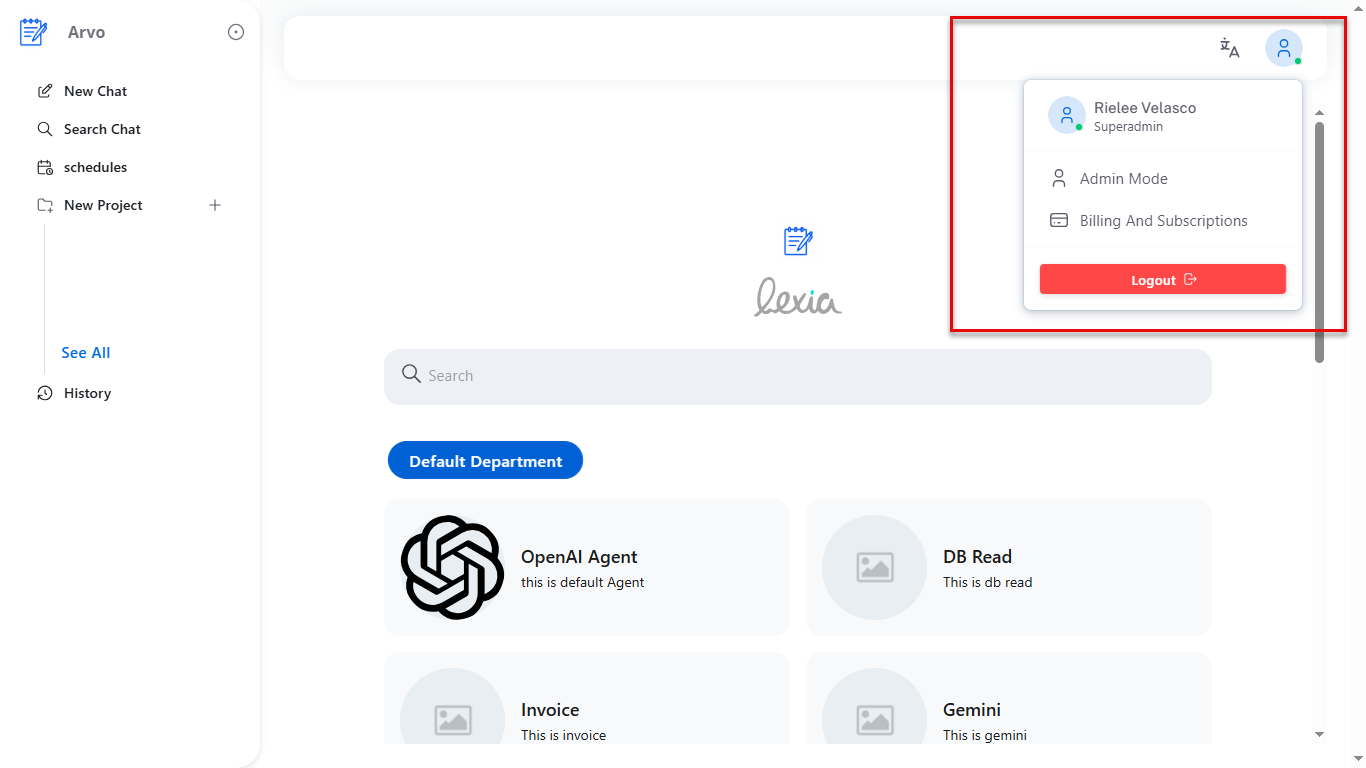 Image: Profile dropdown menu showing user name, role, and menu options
Language Selector
Change the interface language.
Currently: English and Spanish.
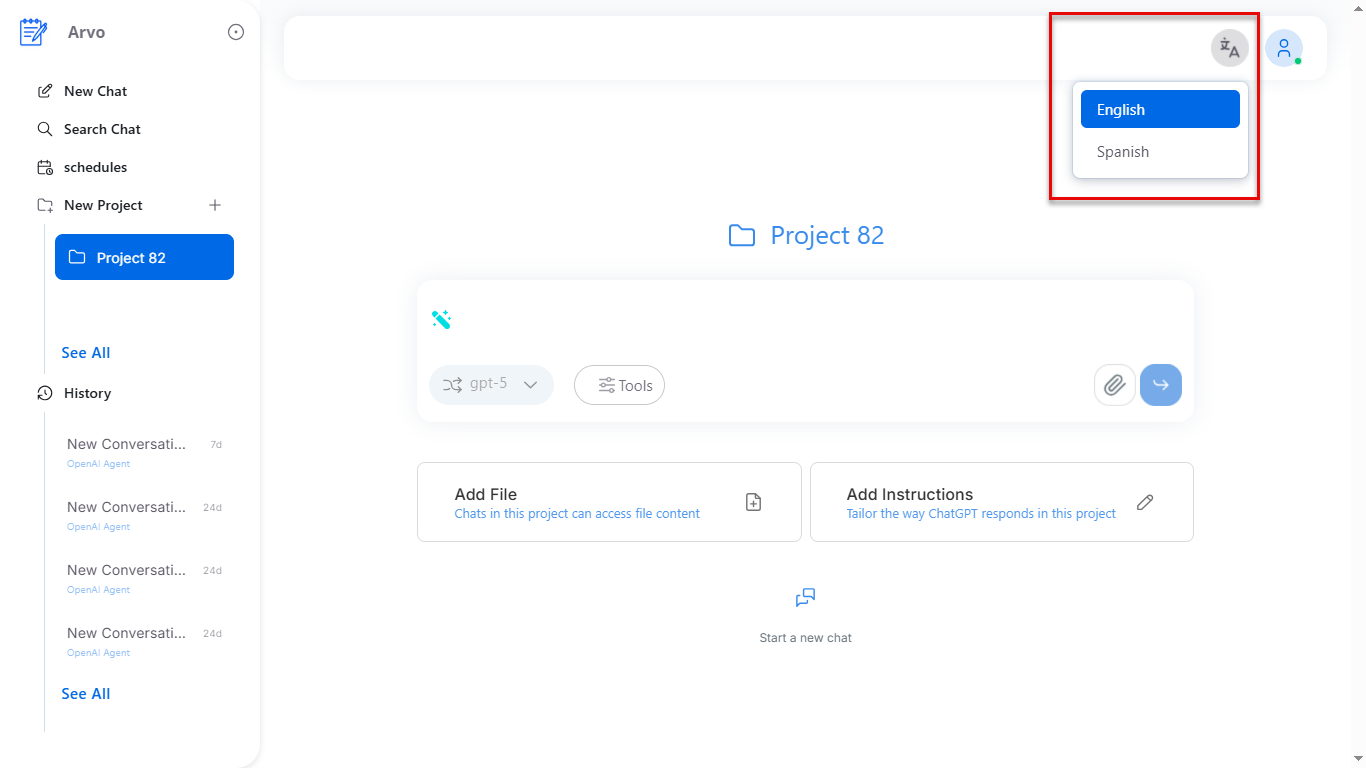 Image: Language selector dropdown showing available languages
Admin Mode
Admin Mode exposes all workspace-level settings:
- Users
- Departments
- Agents
- Moderators
- Embedding
- Workspace configuration
All changes here reflect in both production and dev, except agents under dev mode run locally.
Developer Mode
Developer Mode is the same interface but connected to your localhost agent.
Nothing else changes.
When you switch to Developer Mode:
- Chats run against your local server
- Function calls are logged in full detail
- You can test changes instantly
- The UI behaves exactly like production
Inside Developer Mode, you will also see:
Configuration Panel
Allows developers to set:
- Model
- System message
- Environment variables
- Force search
- Force code generation
This affects only the local agent.
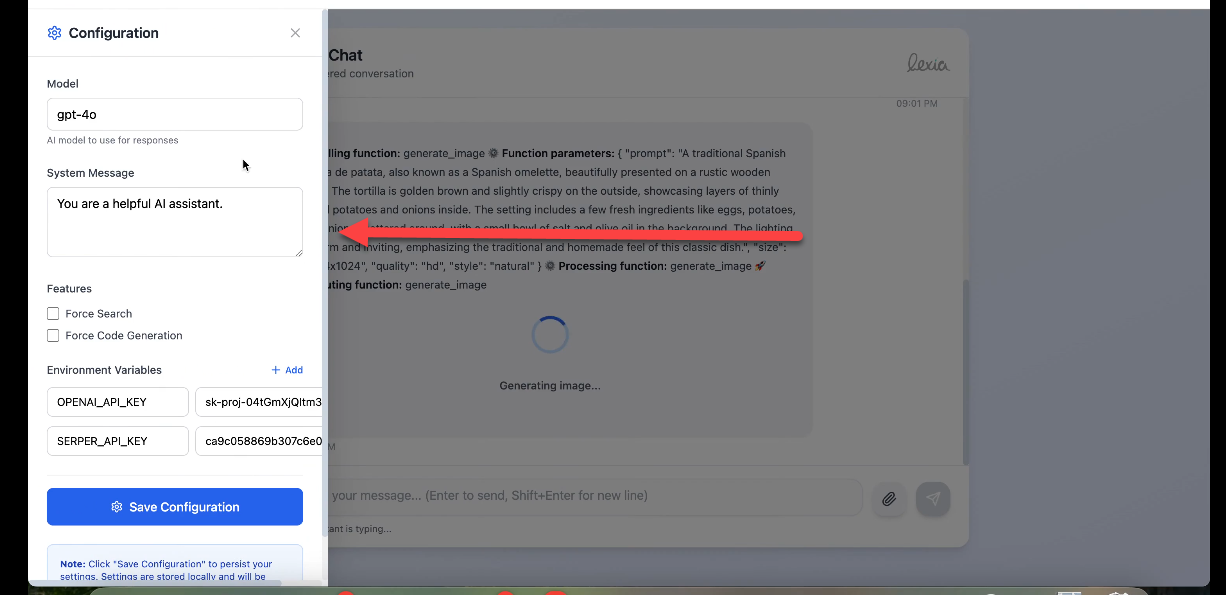 Image: Developer Mode configuration panel with settings for model, system message, environment variables, and force options
Function Call Tracing
Shows detailed internal steps such as:
- Called function
- Parameters
- Processing function
- Execution flow
- Live logs
This is for debugging only but uses the same chat window.
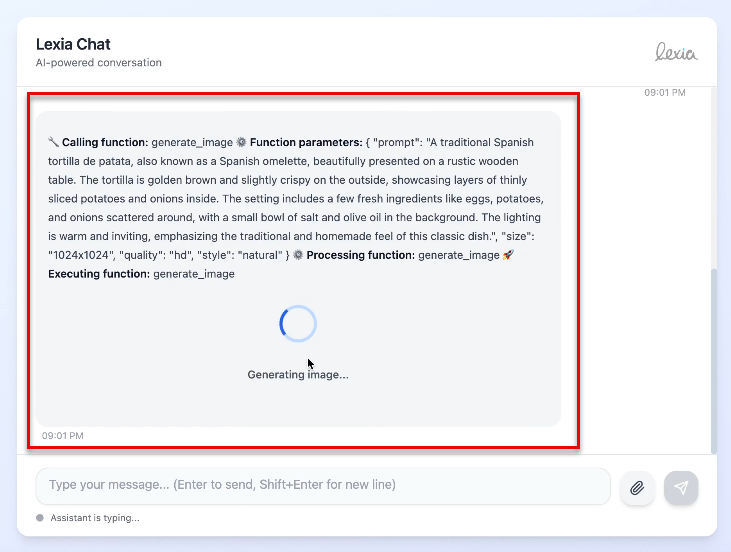 Image: Function call tracing view showing detailed execution logs, parameters, and processing steps
Summary
Lexia uses one unified interface.
Everything you see in production is exactly what you see in developer mode.
The only difference is:
- Prod → connected to deployed agents
- Dev → connected to localhost for testing
Everything else — chats, projects, layouts, file uploads, schedules, search, tools, UI, modals — remains the same.